
A. Introduction
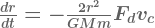
Here is a lovely application of energy conservation and the “work-energy theorem” that will surely intrigue your first-year physics students. A satellite in low Earth orbit experiences a drag force 

This “paradox” has been around since the 1950’s, but to my knowledge it is not treated in introductory physics textbooks. One of the clearest and most complete solutions was given by B. D. Mills in 1959, and we will use his approach in the following paragraphs. As usual, the presentation will be simplified as much as possible to make it tractable for introductory students.
B. The Satellite Drag Paradox
Let the satellite be moving on a low Earth near-circular trajectory with a slowly decreasing orbital radius 


(1)
and it increases as the orbital radius decreases. The kinetic energy of a body 

(2)
where 

(3)
These results should be familiar to students.
1. Using Eqns. 2 and 3, verify that as 


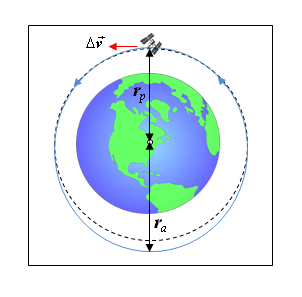
If the spacecraft’s orbit is initially elliptical (as opposed to circular), it will soon circularize due to the atmospheric drag force. The drag force increases dramatically at lower altitudes, so it will be greatest when the spacecraft passes through perigee. Imagine that the drag force produces an instantaneous negative impulse at perigee, with change in velocity 


For a spacecraft experiencing a drag force 

or
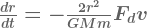
Figure 2 illustrates the forces acting on the satellite, and the components of its velocity: 


(4)

Using the work-energy theorem 


(5)
where 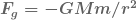


(6)
Surprisingly, the drag term appears in Eqn. 6 without a minus sign! As described by Mills, it is “as if the air drag force, reversed, were pushing the satellite.”
2. In your own words, resolve the paradox noted by Mills.
C. Application: The International Space Station (ISS)
The International Space Station (Fig. 1) is maintained in a near-circular orbit of approximate altitude 400 km. Figure 3 (Ref. 2) is a plot of the ISS’s mean altitude vs. time, and shows how the altitude is periodically boosted (the near-vertical line segments) and how it decays between boosts. For an on-board demonstration of what ISS astronauts experience during a “reboost,” see Ref. 4.

In November 2016, the ISS was boosted to a mean altitude of 406.5 km, and then fell steadily to 404.5 km over the subsequent three month interval (92 d).
3. What is the orbital speed of the ISS at an altitude of about 400 km? (Ans: 7.66 km/s)
4. From November 2016 to February 2017, the altitude decreased by 2 km. Verify that 
5. Calculate the change in the orbital speed 

Now let’s calculate how much rocket fuel must be consumed to boost the ISS back to its original altitude of 406.5 km. To keep things simple, let’s assume that the boost is done in a single short burn, as shown in Figure 4. A single burn will change a circular orbit to an elliptical one, with perigee 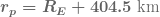


The change in the ISS’s orbital energy due to the burn is

where 


6. What is the change of velocity needed to boost the altitude of the ISS by 2.0 km? (Ans: 1.13 km/s)
ISS orbit boosts are carried out using thrusters on the cargo spacecraft that supply the ISS, such as the Russian Progress modules. (In the past, the US Space Shuttles were used.) The Progress thrusters use a fuel (UDMH + NTO) with exhaust velocity 2.7 km/s.
7. The mass of the ISS is 
8. Calculate the magnitude of the drag force 
9. In ref. 4, astronaut Jeff Williams discusses what happens during a typical orbit boost. For the maneuver shown in the video, 

10. Does your answer to Question 7 include the fuel required to overcome the drag that lowered the orbit in the first place? Why is this a small correction? (Ans: the duration of the reboost is only a few minutes, whereas the orbital period is about 90 minutes. It took many orbits for the drag force to lower the ISS’s altitude.)
11. There are at least two minor misstatements in the video of Ref. 4. Can you spot them? (Ans: At 1:09, Williams states that because of atmospheric drag, “over a period of time we slow down and our altitude over the Earth decreases. At 3:04 he states “We’re in weightlessness right now, and there’s no acceleration …” Actually, he and the ISS are undergoing centripetal acceleration of about 
Acknowledgment
After writing a draft of this post, I asked Dr. Philip Blanco – a valued contributor to this blog – to review it for correctness and to offer suggestions for improvement. He not only did that, but also supplied a numerical simulation of the trajectory of an ISS-like spacecraft immersed in a thin atmosphere. His solution, shown below (Figure 5), shows that the spacecraft indeed follows a near-circular orbit right up to the point where a catastrophe occurs, whence it plunges toward Earth. It would be interesting to calculate when that catastrophe occurs.
My thanks to Dr. Blanco for his assistance. Of course, I bear the full responsibility for any remaining errors.

References
1. Blake D. Mills, Am. J. Phys. 27, 115 (1959)
2. Chris Peat, http://www.heavens-above.com/IssHeight.aspx
3. Robert Frost, https://www.quora.com/How-does-the-International-Space-Station-maintain-its-orbit-and-what-propellant-does-it-use
4. https://www.youtube.com/watch?v=sI8ldDyr3G0, courtesy NASA Johnson Space Center
5. Leon Blitzer, Am. J. Phys. 39, 882 (1971)

Just to elaborate on the drag force calculation for Q. 8. From the information given just below Fig. 3, if the altitude fell by 2 km in 92 days, that corresponds to an average dr/dt = (2000 m / 92 days/ 86400 s/day) = 0.00025 m/s.
Then from Equation 4 with GM = 3.986E+14, r = (400 km + 6378 km) = 6.778E+6 m, and the ISS mass is 4.2E+5 kg, and orbital speed vc = 7668 m/s, we find the drag force to be FD=0.0598 N, rounded to 0.060 N. Not very much for such a large object moving at high speed – the atmosphere up there must be very thin indeed!
Also note that Eq. 4 simplifies to dr/dt = -2 (FD/Fg) * vc, where Fg is the gravitational force on the ISS. Or using vc = Sqrt[GM/r] , it can also be written directly as dr/dt = -2 FD /m Sqrt[r^3/GM].
LikeLike
Professor Camato,
Is there a reason for the 5 km drop-and-boost around 10 January 2017? There was no strong geomagnetic storm at that time. Maybe a maneuver? Thank you for the nice post.
LikeLike
Dear Jans, I don’t know the answer, but I’ve written to Chris Peat (Heavens Above) and asked him if it’s real or just a data glitch. I’ll let you know what he says. If you find the answer before me, please let me know. Thanks. Joe A.
LikeLike
Hi Joe,
I was wondering if you received any feedback from Chris Peat. Thank you for looking into this!
LikeLike
No, I did not hear from him, Jan, and I failed to follow up. I apologize. I’ll try again and also try other possible sources. Thanks for reminding me.
Joe
On Fri, Mar 2, 2018 at 5:11 AM, Physics From Planet Earth wrote:
>
LikeLike
Jan, Chris Peat replied immediately with this response:
“It is very unlikely that there would be a sudden drop in altitude of the ISS. This would correspond to a de-boost and would be a waste of fuel under normal circumstances. In the days of the Shuttle, this was infrequently done to increase the payload capacity of the Shuttle when delivering new supplies, however, since then there have been no de-boosts as far as I know. So this was probably just a glitch in the published data, and if I look at the chart now, I can no longer see it. It has probably been corrected by Space-Track.”
Thanks to you and Chris for raising the issue and resolving it.
Joe
LikeLike
OK, great! Thank you for this interesting information!
LikeLike